One screen unified management of the entire domain PV! Distributed PV Smart Management Screen Reshaping Intelligence O&M
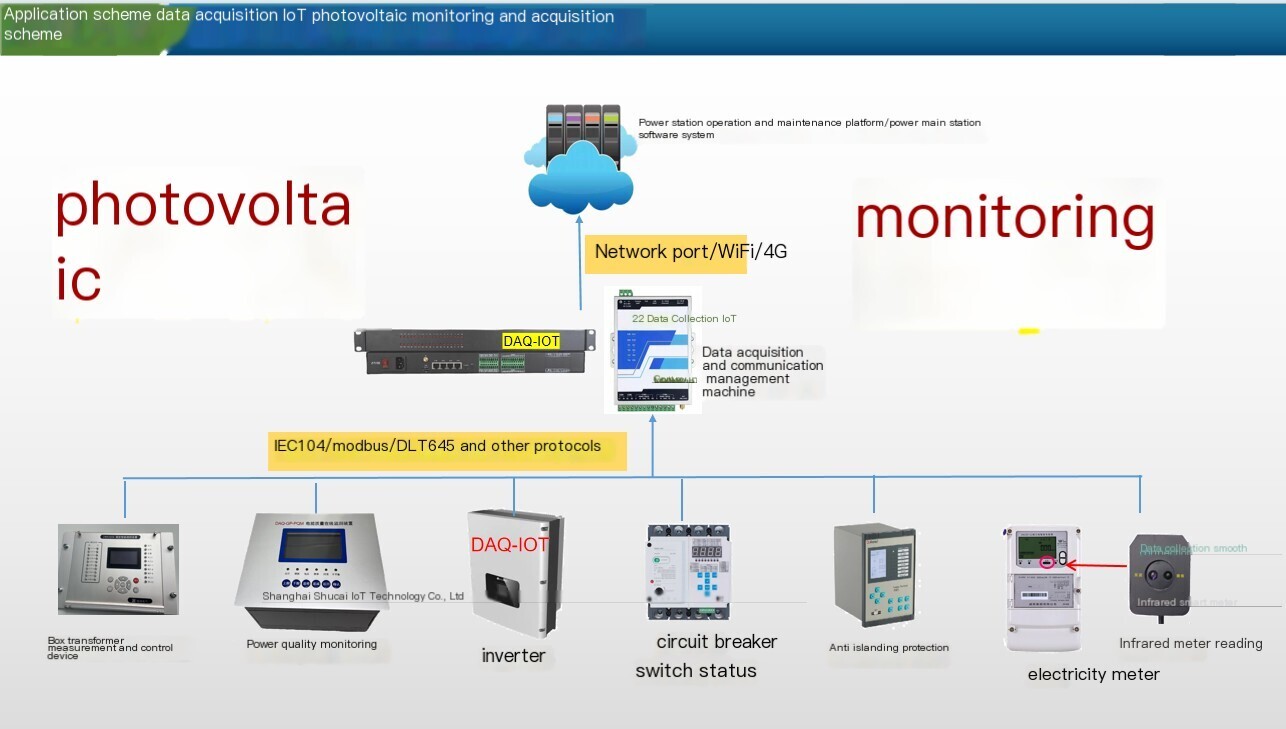
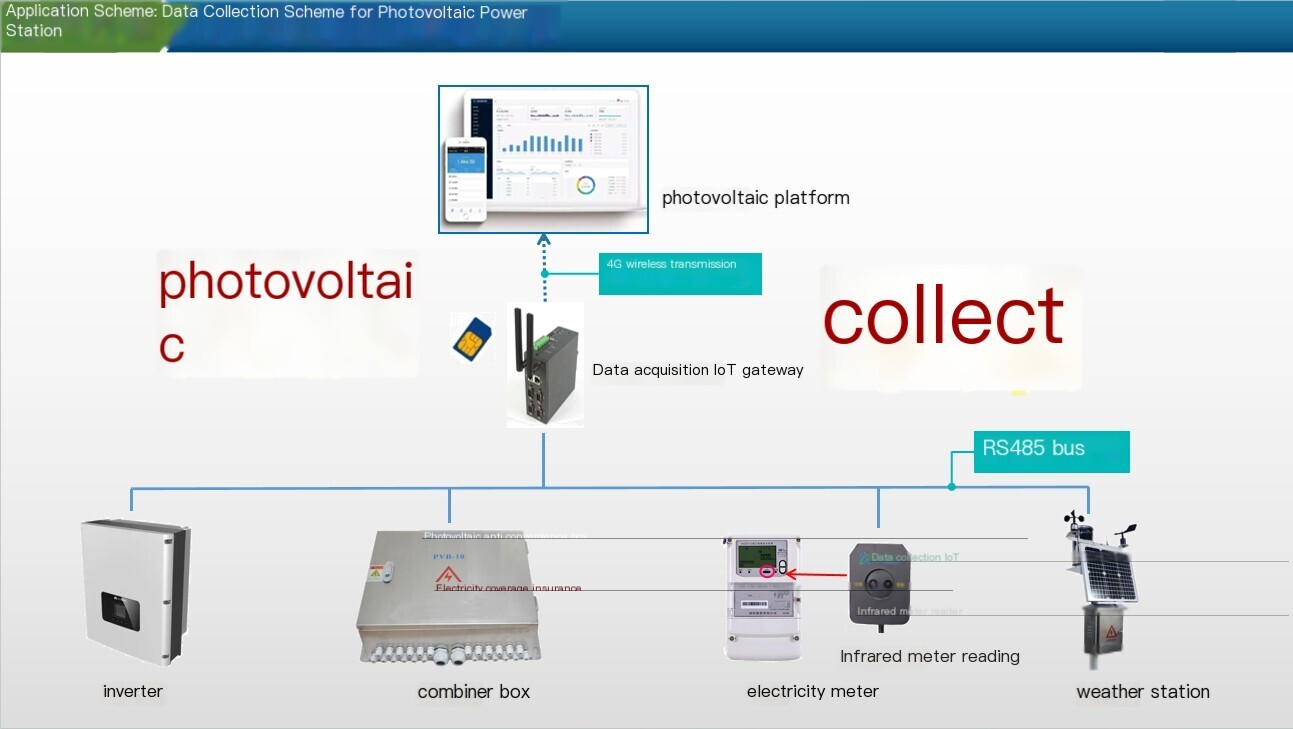
Distributed PV sites are scattered, data is scattered, troubleshooting lags behind, and O&M costs are highNew energyCommon pain points in operation. thisDistributed PV Smart Management Visualization Screen, relying onIoTReal-time Collection andData AnalyticsOne stop coverage of asset monitoring, power generation statistics, fault warning, work order O&M, and benefit carbon emission analysis, achievingPV power stationUnmanned digital control.
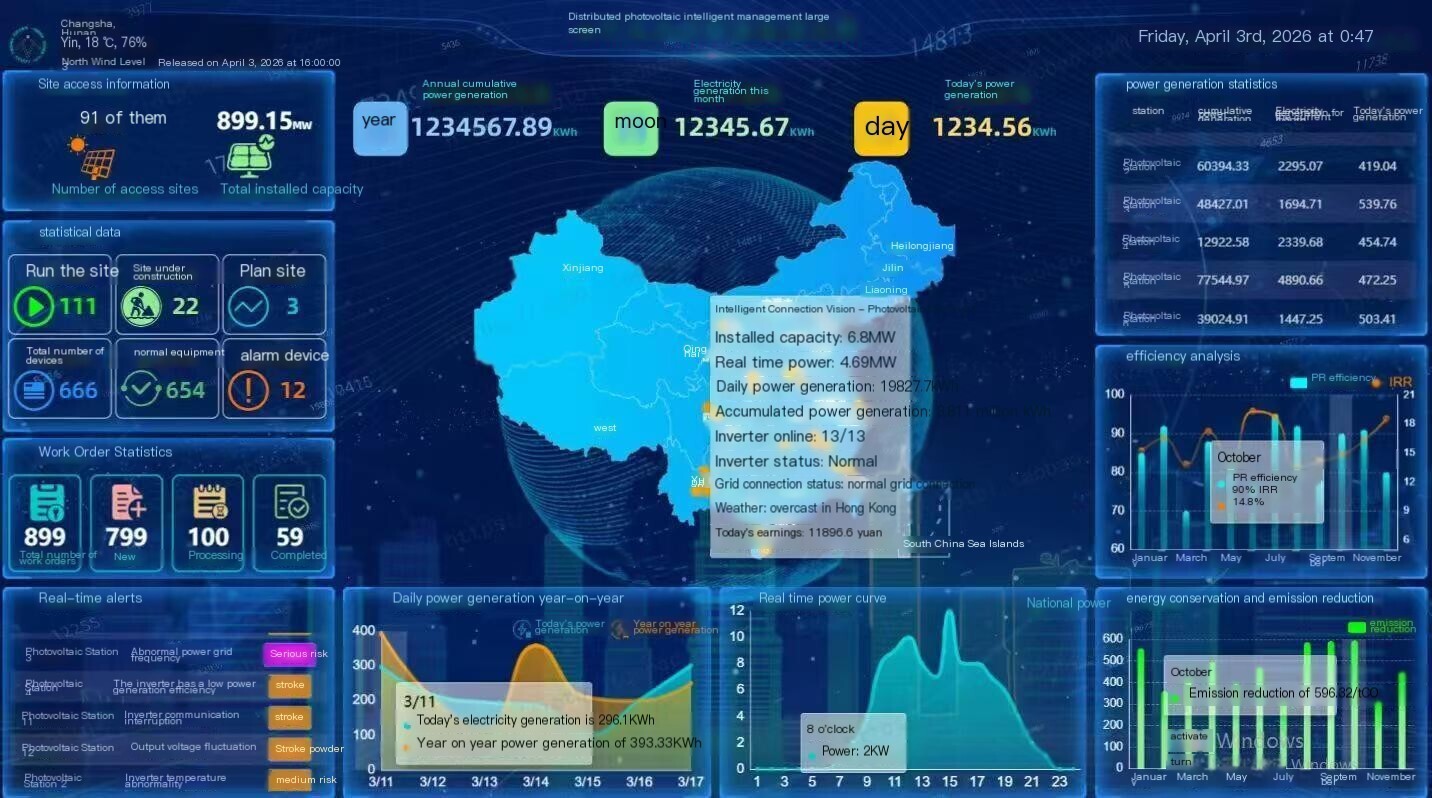
The large screen intuitively displays the overall assets of the entire area: it is connected to 91PVstations, with a total installed capacity of 899.15MW, and clearly distinguishes between three types of stations: operating, under construction, and planned; 666 devices Real-time are monitored, with normal and alarm devices displayed in different zones, and the overall asset status is clear at a glance.
Year, month, and day levelspower generationThe data Real-time has been updated, and the power generation details of each substation are clearly listed. Clicking on the map for a single substation can retrieve itinstalled capacity、 Real-time provides details such as power, daily revenue, and grid connection status. The system automatically calculates power generation revenue, eliminating the need for manual meter reading and accounting, and ensuring accurate and traceable data.
The platform is equipped with a second level Real-time alarm function,Inverter failureClassify and label issues such as voltage fluctuations and power grid anomalies, and accurately locate stations; Supporting the entire online work order system, the creation, disposal, and archiving of work orders are circulated online, transforming post repair into pre warning, significantly reducing inspection manpower and power generation losses.
Simultaneously multidimensionaldata chartSupporting scientific decision-making: PR power generation efficiency, investmentYield curveVisually evaluate the operational quality of the power station; 24-hour Real-timepower curveA year-on-year chart of power generation, quickly identifying the causes of power generation fluctuations; Automatically calculate carbon dioxide emission reductions for enterprisescarbon neutralityDeclare and provide complete data vouchers.
Applicable toindustry and commerceVarious scenarios such as rooftop PV, multi area contiguous power stations, and new energy O&M enterprises can be monitored on one screen O&M、 Integration of analysis and accounting,cost reduction and efficiency improvementMaximize releasePV AssetsPower generation and green value, opening up a new paradigm of distributed PV intelligent O&M.


评论
发表评论