Distributed PV Wind Farm Station Energy Centralized Control Platform
As a professional provider of IoT data acquisition solutions and an expert in industrial IoT data acquisition, the editor of Shanghai Data Acquisition IOT Technology Co., Ltd, (daq-iot) hereby presents the following introduction, and sincerely welcomes discussions and exchanges. Supported Communication Interfaces: CAN, RS485, Mbus, 4–20mA, Profibus, CC-Link, HART, digital I/O, etc. Industrial Protocols: Modbus RTU/TCP, HJ212, IEC104, DLT645, DLMS, IEC61850, MQTT, etc. Mail:export@daq-iot.com
Main Wiring DiagramThe screen displays the total daily, monthly, annual, and cumulative power generation of the entire station, instantaneous power, comprehensive efficiency, and hours of full operation
Each switch (high and low voltage) has remote measurements of current, active power, reactive power, and power factor
Bus has three-phase voltage remote measurement
Switch and transformer numbers can be associated to enter sub pages
Remote control operation is possible
Each transformer should be labeled with transformer capacity, component capacity, daily power generation, and cumulative power generation
The inverter should have a running status signalLight sign indicator light(Normal operation shows normal display, any abnormal display can be associated with the abnormal inverter sub screen by clicking on it)
The switch displays three-phase current, voltage, frequency, active power, reactive power, and power factor
To be labeled with CT transformation ratio
Protective pressure plate status and remote on-site indication status
Continuing insurance modelAnd the communication status can be retrieved from the fixed value list
All protective remote signaling signals put into use
Remote control operation is possible
PT sub screen is similar to switch screen
Transformer screens should have remote signaling and remote measurement of high and low voltage side switch status
Remote measurement of transformer winding temperature is required
Transformer protection remote signal quantity (including non electric quantity protection)
The positive and negative active and reactive power quantities of each high-voltage and low-voltage side meter on the screen of the transformer substation
Power Quality Diagram All telemetry and remote signal quantities of the electric energy monitoring instrument
All public signals in the public signal diagram
DC system diagram DC system wiring diagram and all signals
All environmental monitoring instrument signals in the environmental monitoring instrument diagram
Comparison of power curves of irradiated Real-time
There is data on the conversion efficiency of inverters throughout the station (chart)
Comprehensive efficiency data of power generation for the entire station (chart)
Communication status diagram, communication network diagram, and status display
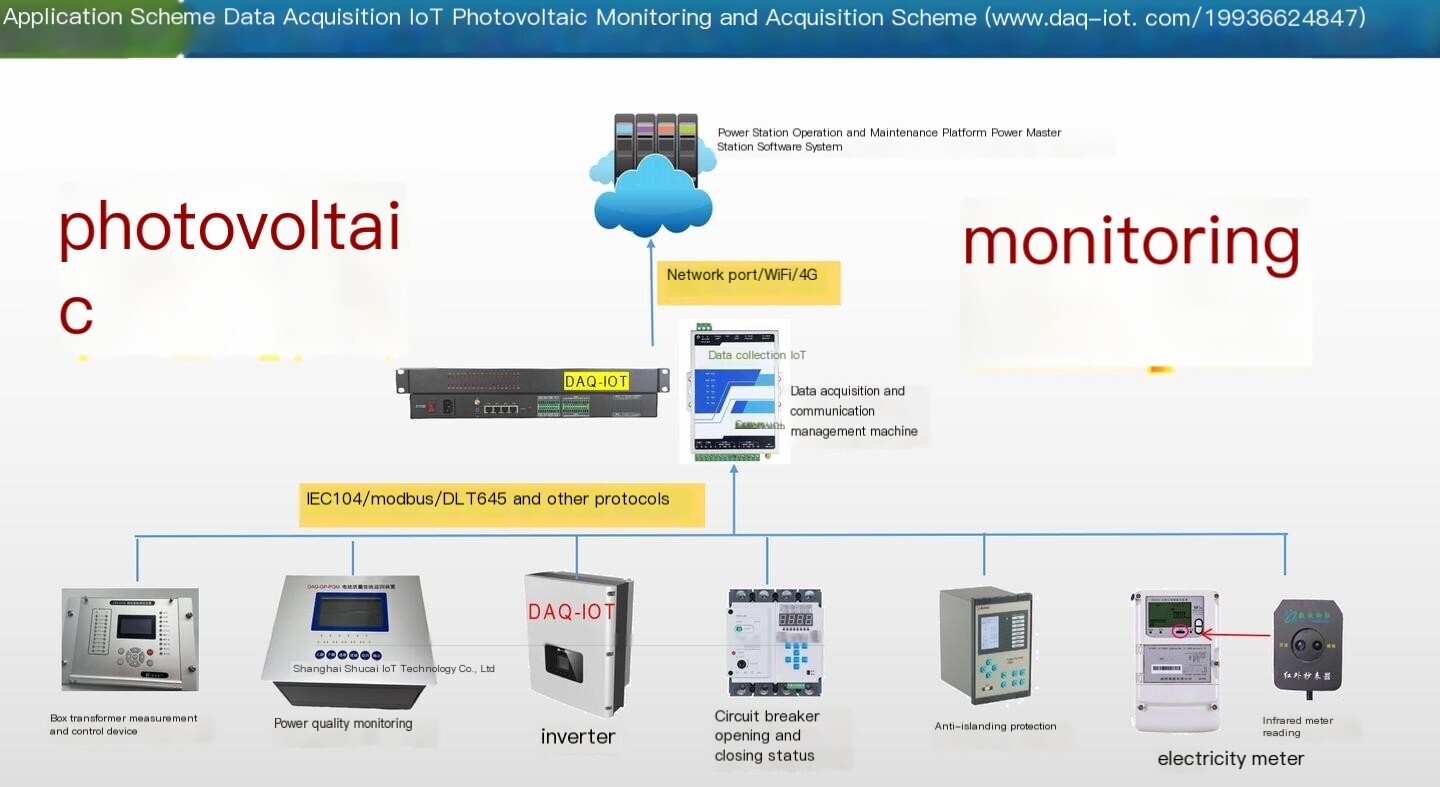
Communication Network Architecture Diagram
Inverter index map There are associated icons for each inverter and data acquisition map
Overview of Inverter Operation Status: Diagram of each inverter's operation status (running, fault, standby), which can be associated with each inverter
Each inverter is labeled with component capacity
Daily power generation and full operating hours of each inverter
Each subarray (divided by box variation) has one screen, and each subarray has a total installed capacity, power generation, and full operating hours.
Inverter data acquisition map, each data acquisition map, including all telemetry, remote signaling, remote control and adjustment quantities within the data acquisition
The inverter diagram has all telemetry and telemetry signals
Has remote control and remote adjustment functions (including remote switching of inverters and power factor adjustment)
If there is any unconnected string, the voltage and current values of the corresponding string in the background should be changed to "standby", otherwise it will be difficult to confirm whether it is unconnected or in an unpowered state in the later stage.


评论
发表评论