EMS Technical Solution for Factory Water, Electricity, Gas and Heat Energy Management System
As a professional provider of IoT data acquisition solutions and an expert in industrial IoT data acquisition, the editor of Shanghai Data Acquisition IOT Technology Co., Ltd, (daq-iot) hereby presents the following introduction, and sincerely welcomes discussions and exchanges. Supported Communication Interfaces: CAN, RS485, Mbus, 4–20mA, Profibus, CC-Link, HART, digital I/O, etc. Industrial Protocols: Modbus RTU/TCP, HJ212, IEC104, DLT645, DLMS, IEC61850, MQTT, etc. Mail:export@daq-iot.com
===================================Tab1========================================
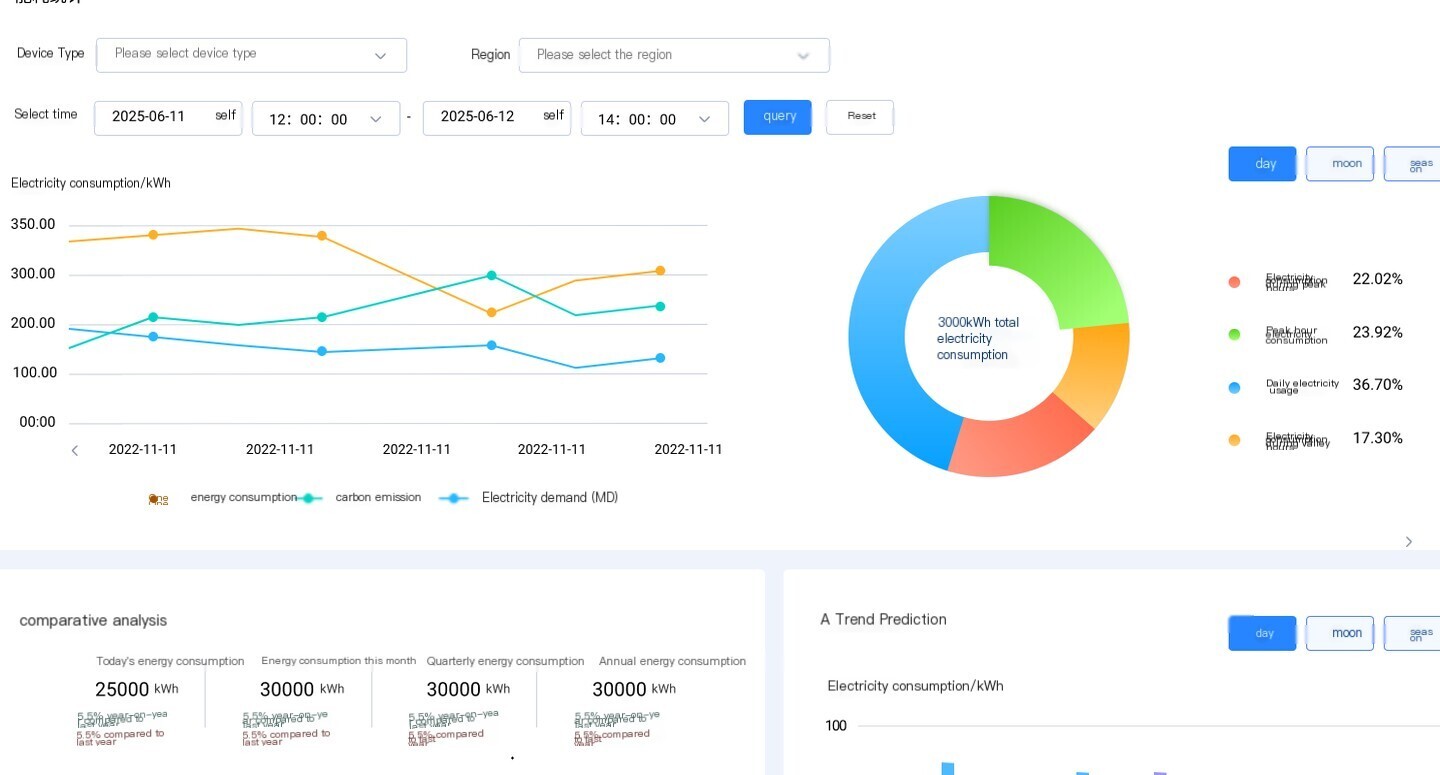
1. Total energy consumption statistics: statistics on daily energy consumption data, supporting graphical display;
4. Sub item energy consumption statistics/analysis: Conduct energy consumption statistics/analysis on energy media such as water, electricity, and gas;
5. Sub item energy consumption statistics/analysis: Conduct statistics/analysis by region based on production capacity, output value, and unit consumption;
Requirement refinement:
- Analyze the device number, device type, total energy consumption, and collection time returned by electrical, gas, and water equipment;
- Support querying total energy consumption by time dimension (year, quarter, month) and region;
- Support comparative statistical analysis of historical total energy consumption data (year-on-year, month on month);
- Provide manual input collection interface (water, electricity, gas)
==================================Tab2=========================================
2、Electricity costBased on the peak and valley of electricity consumption and electricity bills, conduct statistical analysis on electricity costs using daily/weekly/monthly/annual statistical dimensions;
3、Integrated water meterBased on water usage and unit price, conduct statistical analysis on water usage costs using daily/weekly/monthly/annual statistical dimensions;
Requirement refinement:
- Support customers to manually input four types of prices, including peak and valley prices, and update the system once. Normally, prices are changed once a month;
- Support querying prices by year, month, and day;
c、 When the electricity meter displays data, it is necessary to indicate whether it is a peak or a flat valley;
==================================Tab3=========================================
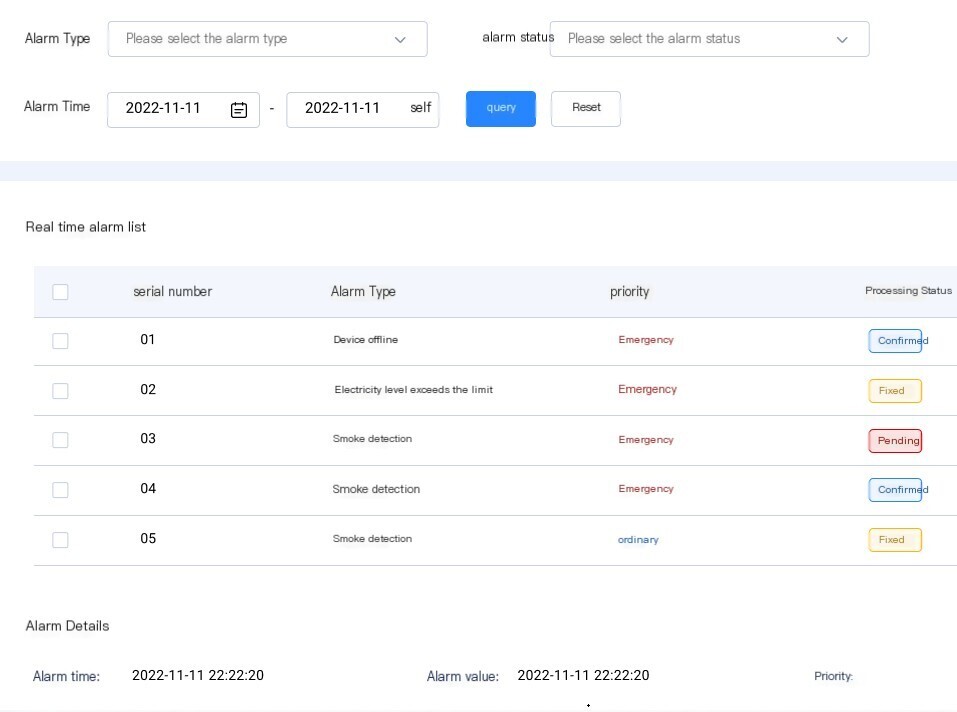
- Regional unit consumption statistics/Analysis: The system supports the display of alarm data sets for devices on a page that displays daily, weekly, and monthly alarm status dashboards;
Requirement refinement:
- A separate tab page;
- Support manually adding alarm types to devices, only offline and abnormal;
- Support querying alarm data by alarm type, status, and time range;
- Clicking on a record allows you to modify the alarm status;
==================================Tab4=========================================
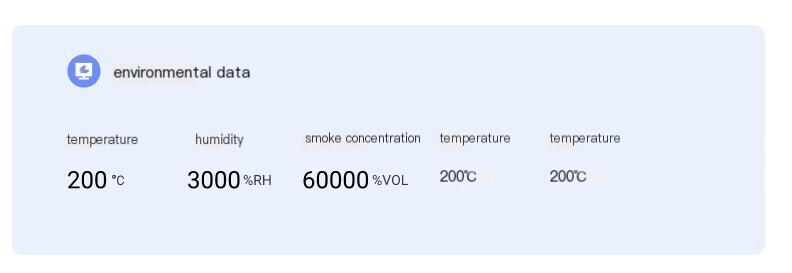
7、Environmental MonitoringMonitor ammonia dioxide, dust, and hydroxide compounds;
8、Environmental testing systemEnvironmental data monitoring, Real-time alarm, etc;
Requirement refinement:
a、 Need to support manual input of data for hydrogen and oxygen compounds;
b、 Display the collected data on nitrogen dioxide, dust, and hydroxide compounds;
==================================Tab4=========================================
9. Solid waste functionalization IoT regulatory system: generate reports on waste production, transportation, and disposal Data Acquisition statistics;
10、Hazardous waste managementData Acquisition Generate statistical reports.
Requirement refinement:
- Similar to inventory management software, it provides information such as selecting input solid waste products and outputting special attributes.
- Master data selection can be achieved, such as department information, personnel information, warehouse information, etc.
- System provides reports: 1. Receipt, shipment, and storage reports 2. Disposal reports
- Export the input uniformly to an Excel spreadsheet;
----On site personnel organize and provide registration content
Note:
a、 All images mentioned in this article are for visual purposes only and do not represent the final product effect;
b、 Kanban modification content:
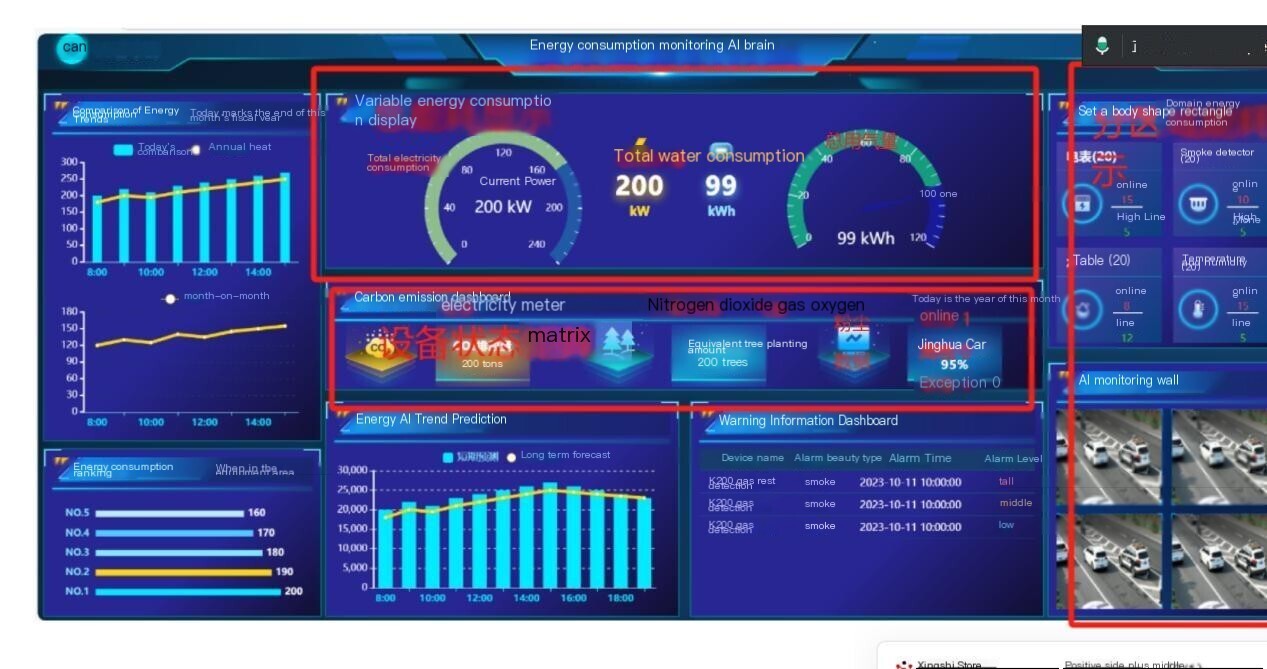
- Login to the left tab of the homepage;
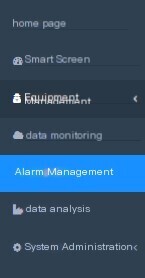
Modify to require all points:
Total energy consumption statistics
Electricity cost
Statistical analysis based on dimensions
Integrated water meter
Sub item energy consumption statistics/analysis
Sub item energy consumption statistics/analysis
Regional unit consumption statistics/analysis
Environmental Monitoring
Environmental testing system
Solid waste functionalization IoT regulatory system
Hazardous waste management


评论
发表评论